A little literature review
Introduction
Literature reviews are an essential part of research. Every new project begins with a PubMed search, filtering results, and hours spent reading abstracts. Often, these efforts don’t yield the information we need; the papers we find aren’t relevant. Is there a faster way to discover pertinent studies?
This week, I decided to explore bibliometrics to streamline the process.
Full disclaimer: I’m new to this field. I’m learning in real time and sharing my findings, so there may be errors or logical gaps.
Research Questions
- How many cell and gene therapy (CGT) papers are published each year?
- Who are the leading authors?
- Which journals publish the most influential CGT research?
- What are the key articles in the field?
Data Collection
To perform a bibliometric analysis, I started with PubMed, defining a broad CGT search and downloading references for each paper. My search query was:
(“1970/01/01″[PDAT] : “2024/12/31″[PDAT]) AND ( “Cell Therapy”[MeSH] OR “Gene Therapy”[MeSH] OR “Genetic Engineering”[MeSH] OR cell therap*[TIAB] OR cellular therap*[TIAB] OR cell-based therap*[TIAB] OR adoptive cell transfer[TIAB] OR adoptive immunotherapy[TIAB] OR CAR T*[TIAB] OR chimeric antigen receptor[TIAB] OR TCR-engineer*[TIAB] OR CAR-NK*[TIAB] OR stem cell therap*[TIAB] OR mesenchymal stem cell*[TIAB] OR hematopoietic stem cell*[TIAB] OR gene therap*[TIAB] OR genetic therap*[TIAB] OR genetic modification[TIAB] OR genetically modified cell*[TIAB] OR viral vector*[TIAB] OR lentiviral vector*[TIAB] OR retroviral vector*[TIAB] OR adenoviral vector*[TIAB] OR AAV[TIAB] OR “adeno-associated virus”[TIAB] OR CRISPR[TIAB] OR “gene edit*”[TIAB] OR “genome edit*”[TIAB] OR ZFN[TIAB] OR TALEN[TIAB] OR meganuclease[TIAB] OR (“ex vivo”[TIAB] AND “gene transfer”[TIAB]) OR (“in vivo”[TIAB] AND “gene transfer”[TIAB]) ) NOT ( “Plants”[MeSH] OR plant*[TIAB] OR transgenic plant*[TIAB] OR crop*[TIAB] OR Arabidopsis[TIAB] OR tobacco[TIAB] OR maize[TIAB] OR rice[TIAB] OR chloroplast[TIAB] )
In summary, this query covers publications from January 1, 1970, to December 31, 2024, includes terms related to cell and gene therapy, and excludes plant-related studies. It yielded 487,995 articles, including 31,873 from 2024 alone. Because PubMed limits downloads to 10,000 records at a time, I split the search by year and month. Unexpectedly, some retrieved articles fell outside my date range, so I needed to deduplicate the data.
I removed duplicates by filtering out rows with identical PubMed IDs (PMIDs). A PMID uniquely identifies each PubMed record and differs from a PubMed Central ID (PMCID).
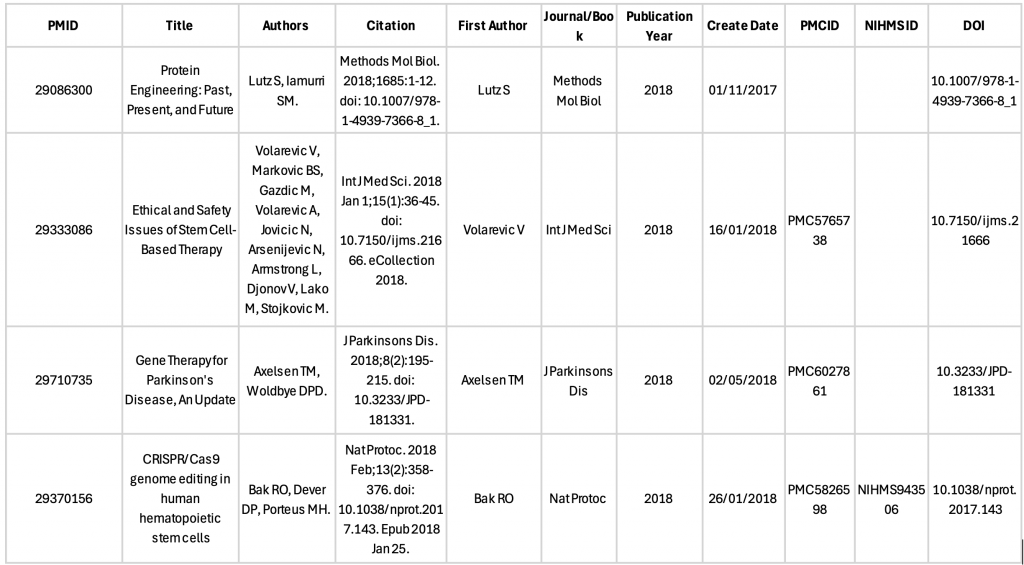
With a clean dataset of unique articles, I examined the data structure:
- PMID
- Article title
- List of authors
- Citation
- First author
- Journal name
- Publication year and date
- Three additional identifiers
To identify the most influential authors, I needed detailed author information. Using the rentrez R package, I fetched affiliations, complete author lists, and abstracts for each PMID. Automating this process for nearly half a million articles took time but was essential.
Preliminary Analysis
My dataset now contains 483,819 unique articles.
Before diving deeper, I checked for missing data. For most analyses, missing fields were minimal, but abstract-based analyses will exclude about 6.5% of articles:
| Field | Missing Count |
|---|---|
| NIHMS | 452,462 |
| Keywords | 300,690 |
| PMCID | 279,074 |
| DOI | 32,141 |
| Abstract | 31,329 |
| Last Author | 30,829 |
| Affiliations | 20,464 |
| Full Author List | 2,400 |
| First Author | 1,873 |
| Authors | 1,864 |
| Journal Title | 570 |
| Article Types | 570 |
| Title | 3 |
| Other (PMID, etc.) | 0 |
Publication Trends
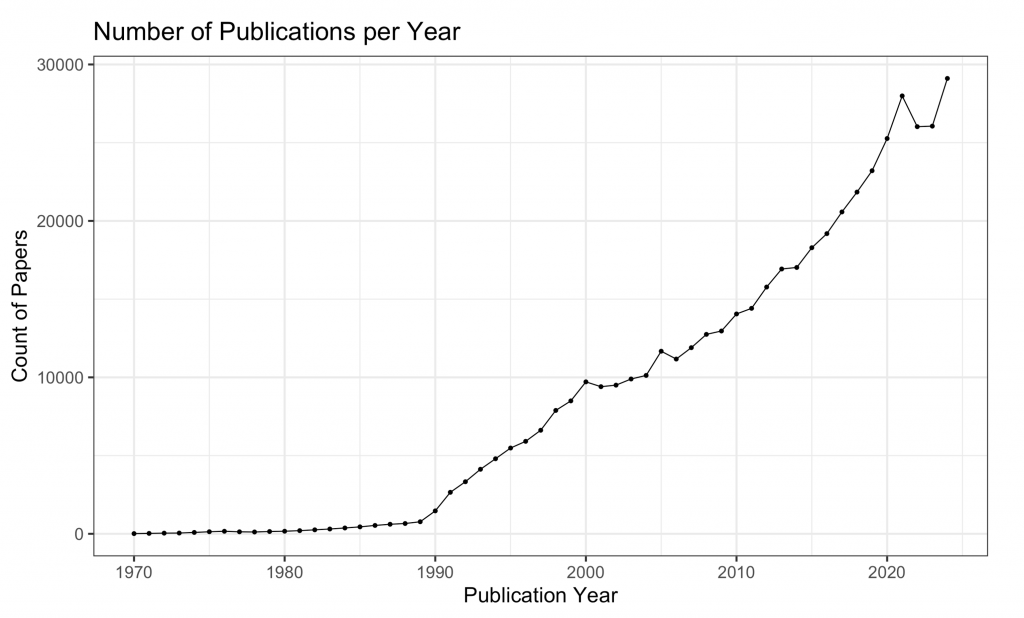
Plotting annual publication counts over 54 years revealed a significant inflection around 1989–1990. Key events include:
- The 1990 launch of the Human Genome Project, offering extensive mapping, sequencing, and bioinformatics resources.
- The first clinical gene therapy trial, infusing adenosine deaminase (ADA) gene–engineered T cells into ADA-SCID patients.
- The debut of Human Gene Therapy, the field’s first dedicated journal.
Publications increased steadily through the 1990s and 2000s. Funding cuts in 2022 caused a downturn, but early 2024 data hint at a slight rebound. Whether growth will resume remains to be seen.
Journal Rankings
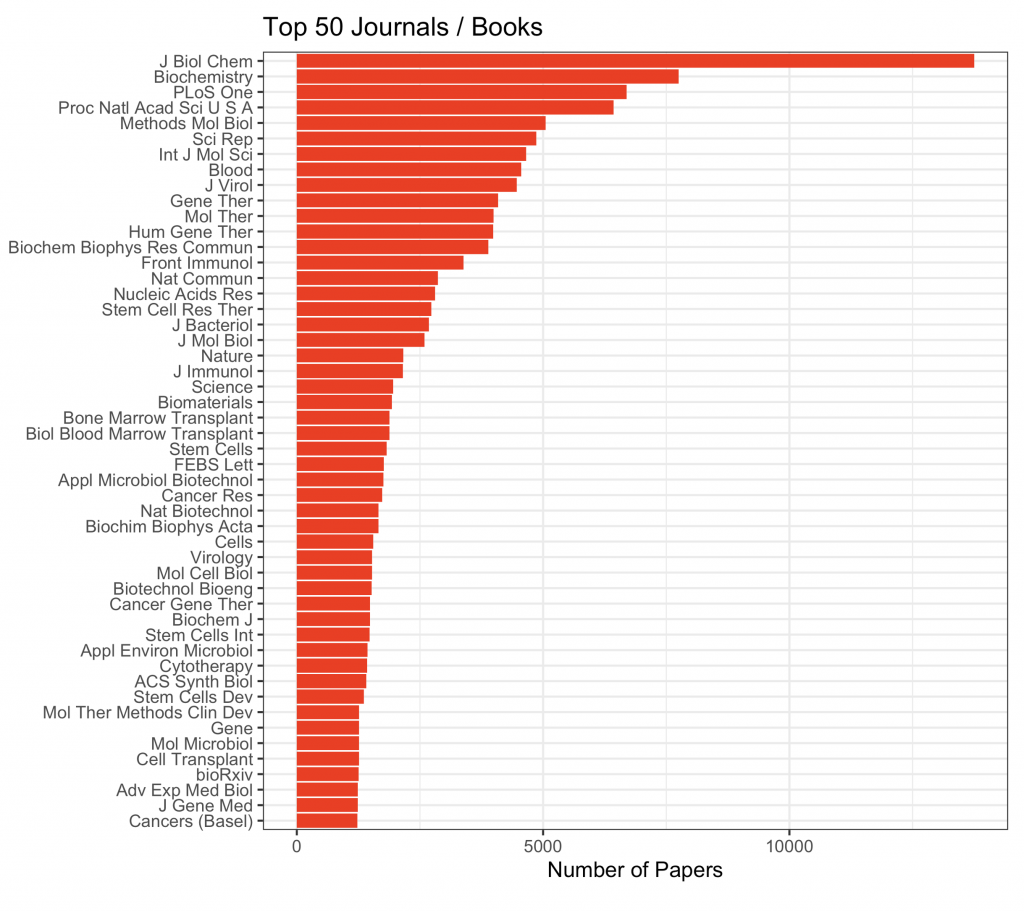
Looking at the top 50 journals there aren’t many surprises here. The Journal of Biological Chemistry is a very traditional journal, with a solid impact factor (4.0 in 2023) but more critically here, has been in print since 1906 and has an open access tier. PLoS One and PNAS are also solid with open access tiers. The expected immunology journals are there as is Science and Nature showing that the field does have impact. Gene Therapy and Human Gene Therapy are in positions 10 and 12 respectively, showing that the field is publishing in dedicated journals too.
Author Rankings
Well, what can I say here? He Huang and James M Wilson are putting us all to shame with over 200 papers each. I don’t know where they get the time. Let us dig a little deeper.
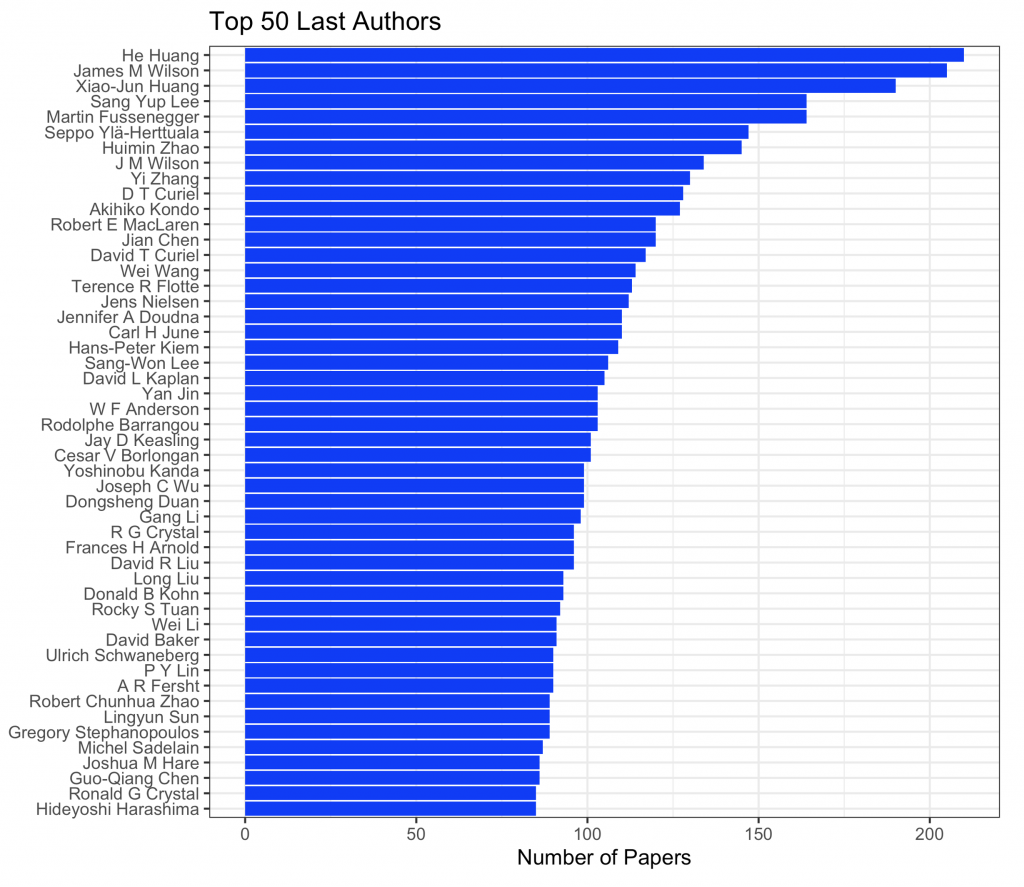
He Huang (ORCID 0000-0002-2723-1621) is a Professor at Zhejiang University with 77 publications listed. He has various board memberships along with a medical degree, so it’s not surprising to have 77 publications. Is He Huang a common name? I’ve not been able to separate authors based on affiliation so I could be merging two or more people’s bibliographies here.
That issue is less likely for James M Willson as we have a middle name to further reduce the chances of two or more people having the same name. James M Wilson (ORCID 0000-0002-9630-3131) is a professor at U. Penn. and has 1029 publications listed on his profile, many of which are to do with AAV. Not all are peer-reviewed articles but from what I can see a lot are, so maybe these ~200 papers are an under estimate?
Article Metrics
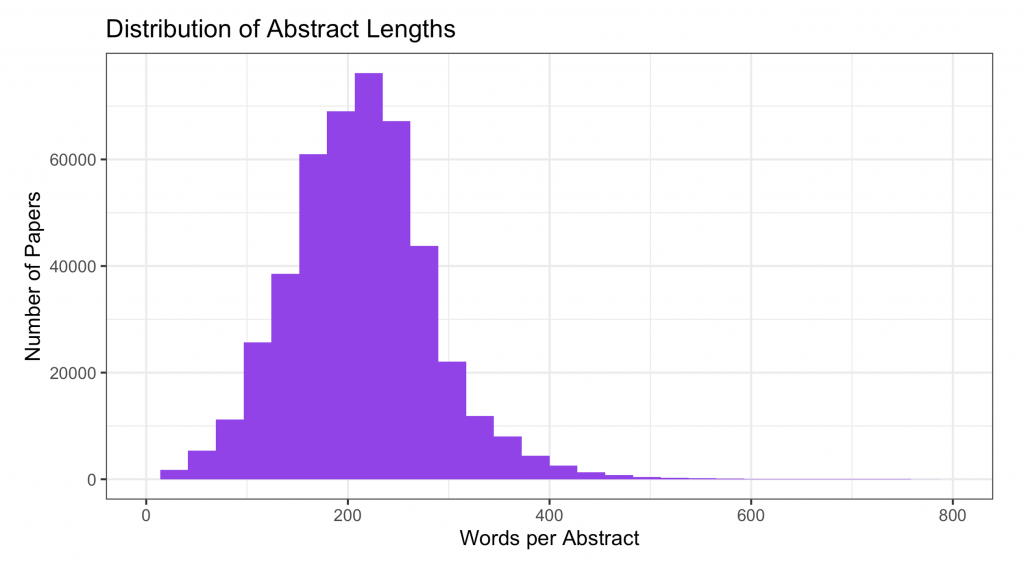
Abstract length isn’t a key metric; most journals stipulate that it needs to be ~250 words. That is exactly what we see here. What I really want to see is the email exchange for the multiple paper with abstracts over 700 words.
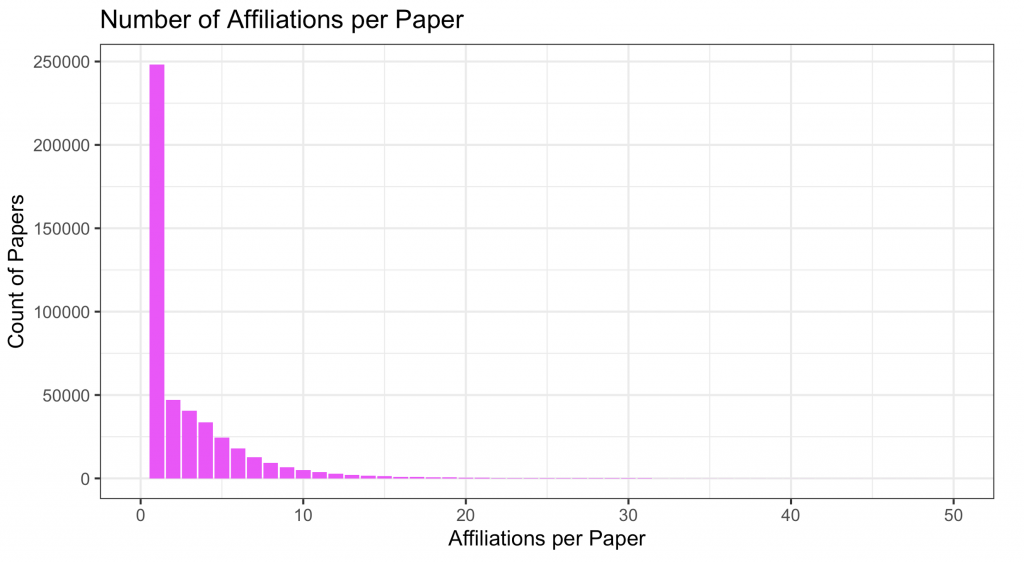
Over half of the papers in this “study” have a single affiliation, meaning that there is little external collaboration in preparation of these data. Given that I have scrapped data from 1950’s onward this isn’t surprising. I have 40 years’ worth of data that pre-dates email.
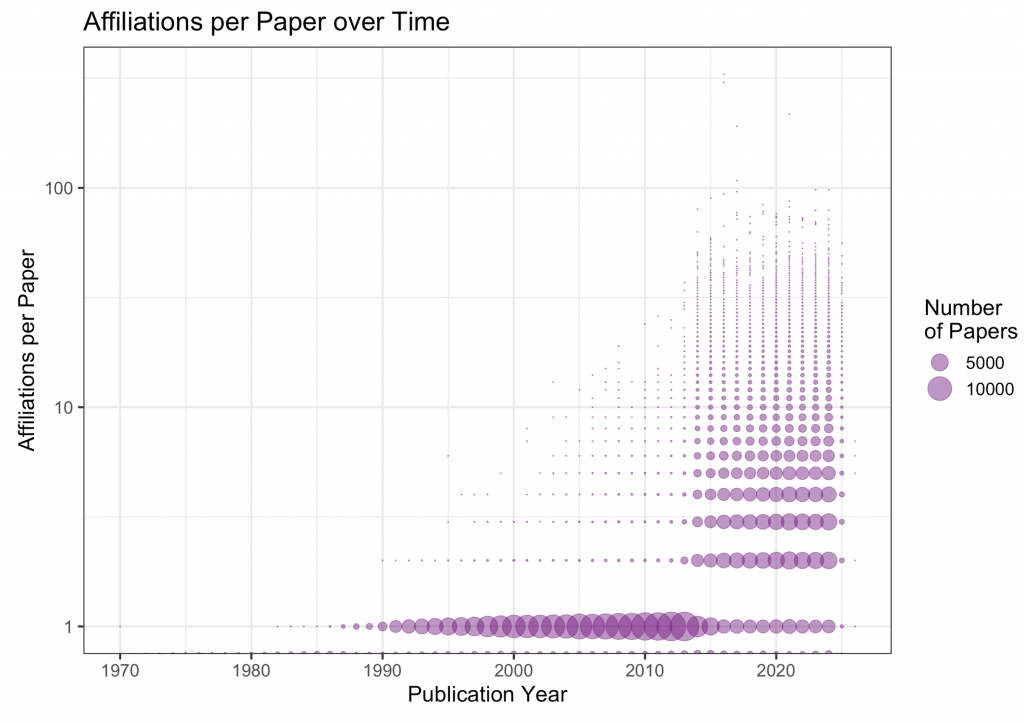
So lets look at the data in a little more detail. My flippant estimation that a lack of email played a part in restricting collaboration doesn’t appear to hold true. When I plot affiliations by year we can see that there is an increase in single institution research from the 1990’s to around 2013. Then in 2013 we start to see an increase in external collaborations. What happened around 2013 that meant we could collaborate more easily? I am going to go out on a limb and suggest that it was Dropbox and similar tools. These tools allowed us to freely share data for the first time. It is true that Dropbox was founded in 2007 and allowed 2GB of data to be transferred from 2011, but there is a short lag in technology adoption and publications. I wonder if this holds true for other fields?
Collaboration Network Analysis
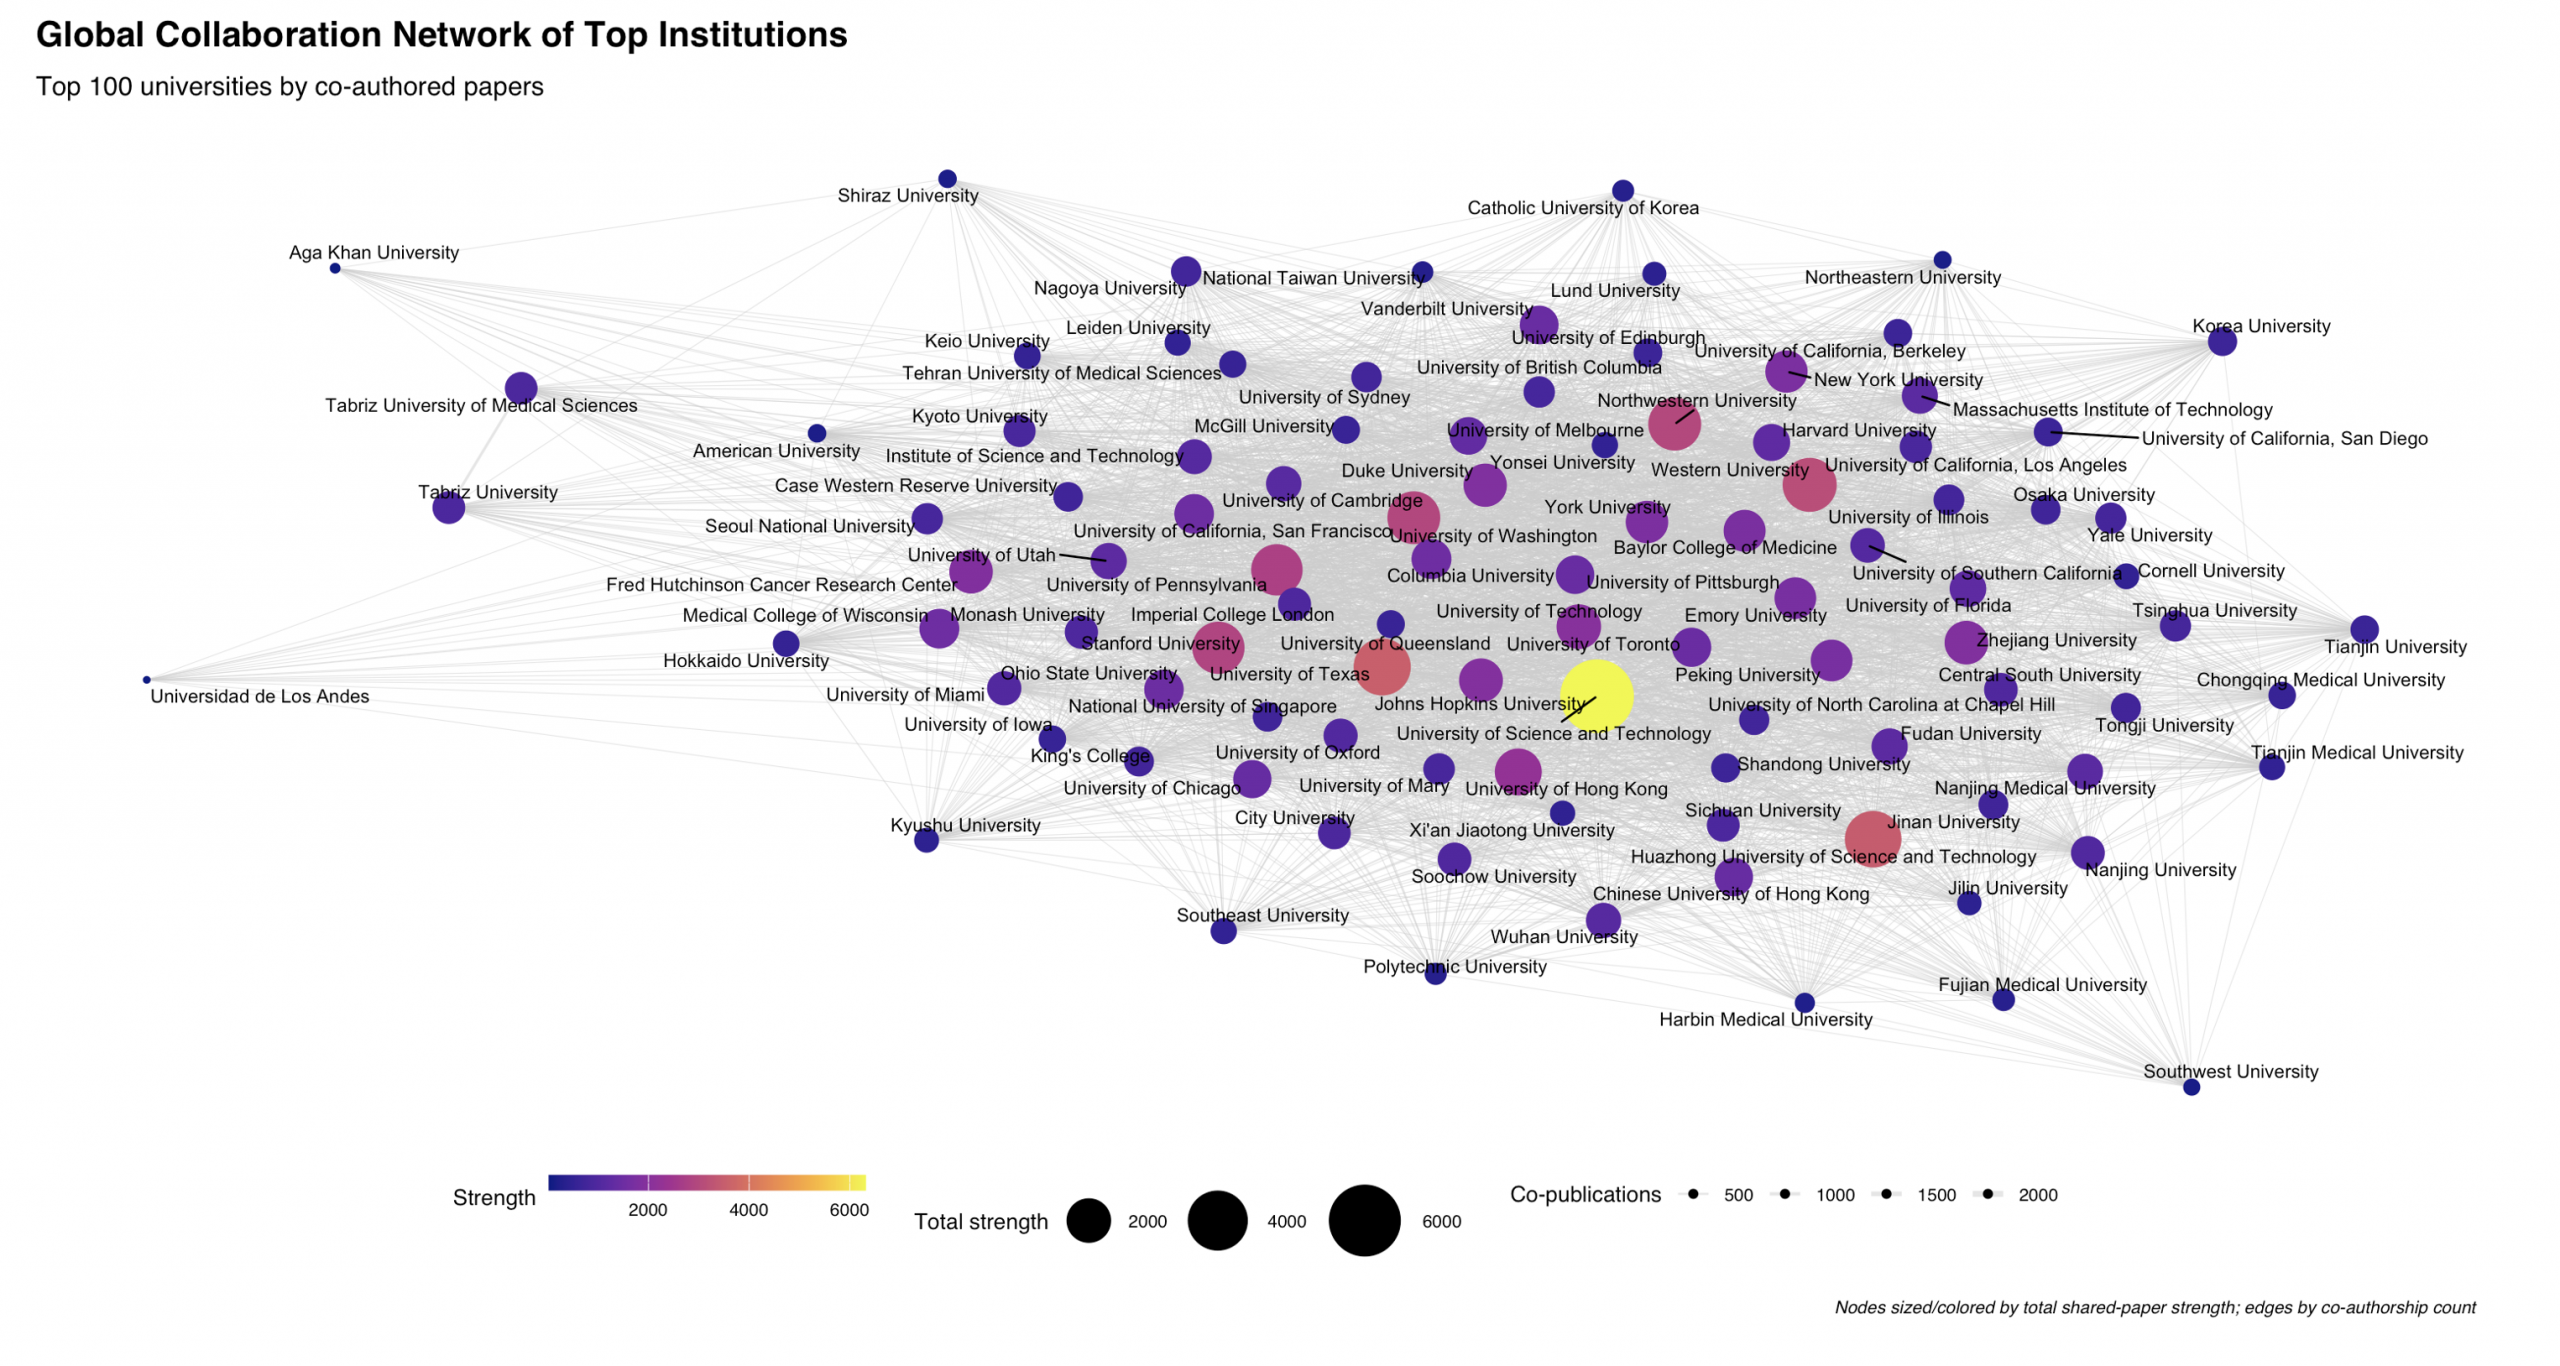
Network analysis is looking for how well connected different nodes are, a node being a University in this case. This network is far from complete! I had to do a lot of manual data wrangling and renaming as affiliations are not standardised. Imperial College London can be written “ICL” or “Imperial College” or many other inventive ways. I have also had to exclude many industry and biotech companies as they too are not standardised in their naming structures. To start the data wrangling process I used the Kaggle.com World Universities dataset and matched the affiliations. I added to this list of universities by searching the affiliations for different spellings of university (to account for different languages) and then selected the preceding or following words.
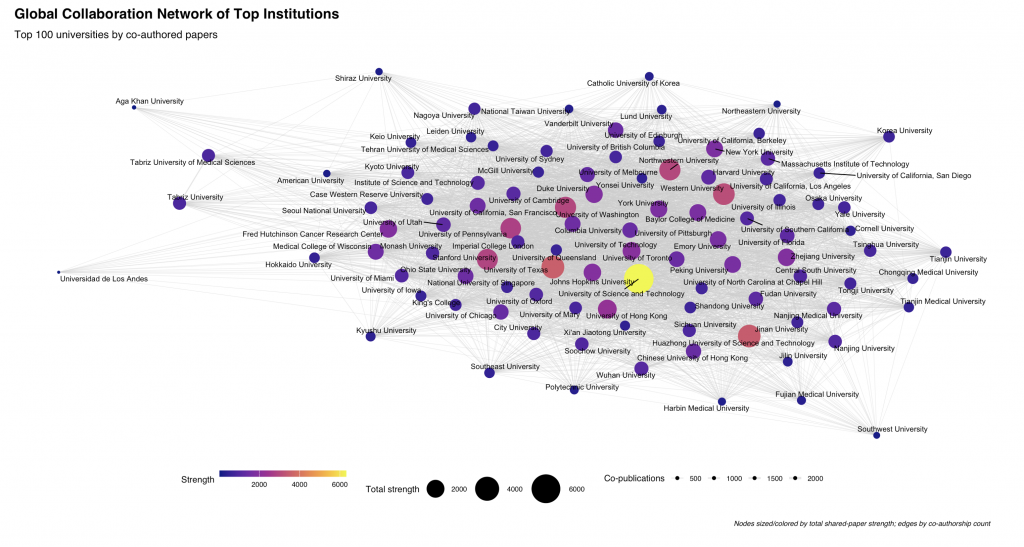
Here are the top 100 universities in the cell and gene therapy field, according to their publication affiliations. The big yellow node at the centre is clearly a data wrangling error as there are multiple universities called the “University of Science and Technology” in different countries.
Notable universities are the University of Texas, Northwestern University, University of Pennsylvania, Cambridge University and Huazhong University of Science and Technology.I would love to be able to plot these universities onto a global map so we can see geographical “hot spots” but time is a little tight. Maybe for the next analysis.
Conclusions
Firstly, on a personal note, I can conclude that this analysis has taken me a week, it was a great teaching exercise and I had no idea how hard it would be to be to get meaningful information out of it. I am very glad I took the time to do it, but I do wish I’d found the lens.org and the bibliometrix() package much sooner. Lens.org is a database of literature and references that is a lot more standardised than PubMed, and almost as complete. The bibliometrix() package does a lot of the data analysis and wrangling in nice, neat functions.
My bibliometric exploration demonstrates that cell and gene therapy research has evolved through distinct phases: a pioneering era around 1990 spurred by landmark projects, steady expansion through the following decades, and a recent dip associated with funding shifts. Despite a modest slowdown in 2022, early indications from 2024 suggest renewed activity, underscoring the field’s resilience and the continued importance of gene- and cell-based interventions.
I don’t think i have been able to answer all the questions I set out to answer. At least not in a way that I find satisfactory. I am not an expert in the field of bibliometrics, far from it, but I do feel I am closer to being able to apply these analysis techniques to my up coming projects.

Leave a Reply